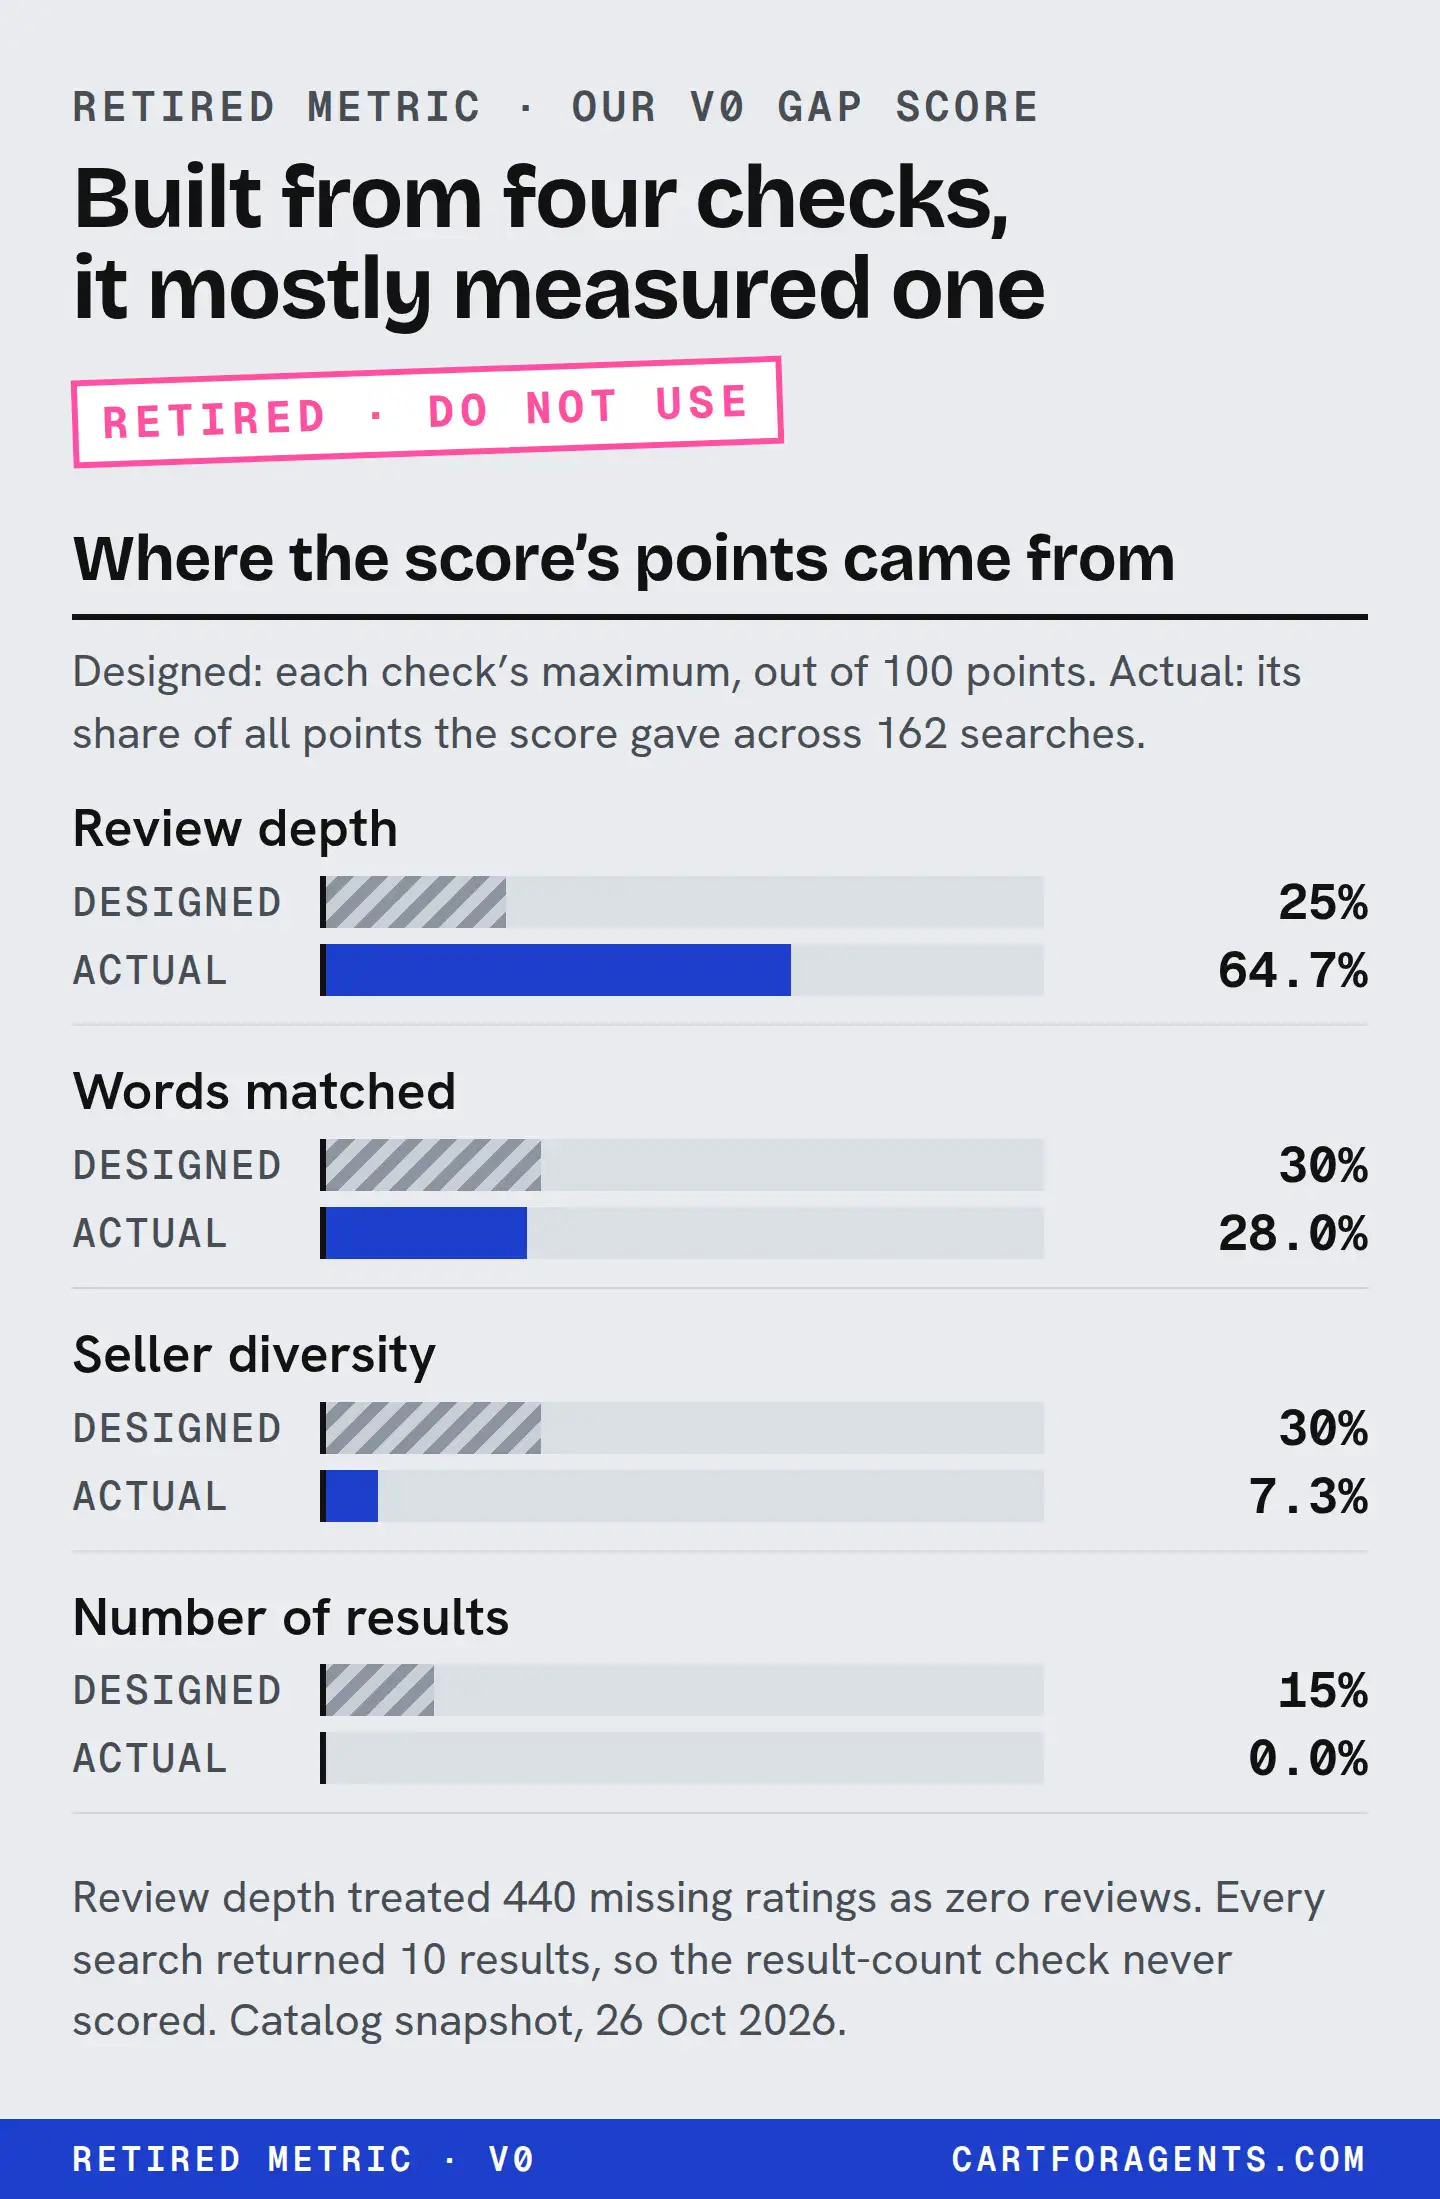
If someone hands you an AI visibility score, for your store or for a whole category, don’t start with the number. Start with its parts. For each part, compare the weight it was given with the share of the score it actually produced. Then check what the score does with blank fields and with numbers written in different units. We ran those checks on our own first score, a 0 to 100 “gap score” from our October 26, 2026 Shopify Catalog snapshot. It failed all of them, so we retired it the same evening.
What follows is the audit, the stop-use record and a short checklist you can run on any score. It’s an audit of our own metric on one catalog snapshot. It doesn’t measure any assistant, and it doesn’t replace the retired score with a new one.
The score we retired
Our first catalog study sent 162 shopper searches to Shopify Catalog, with no buyer context, and kept the top 10 results of each. The idea was to give every search a “gap score”: higher meant a weaker shelf for that need, and so, we assumed, more opportunity. It added up four parts.
| Part | Design weight (max points) | How it scored | What it was meant to show |
|---|---|---|---|
| Review depth | 25 | Points when the median product rating count of the ten was under 200 | Thin social proof on the shelf |
| Word match | 30 | Points for each search word missing from the top 3 results’ text | Listings that don’t answer the question |
| Seller variety | 30 | Points when the ten came from fewer than 6 distinct sellers | One seller dominating |
| Result count | 15 | Points when fewer than 10 results came back | A thin shelf |
It looked balanced on paper: no part over 30%. The first step of the audit is to check whether it behaved that way.
Audit 1: weights versus what each part actually contributed
We re-ran the original scoring code, unchanged, on the 162 saved responses. It reproduced every stored score. Then we split each search’s score into its four parts and added them up across all 162 searches.
| Part | Design weight | Share of all points awarded | Share of the spread between searches |
|---|---|---|---|
| Review depth | 25% | 64.7% | 74.0% |
| Word match | 30% | 28.0% | 17.3% |
| Seller variety | 30% | 7.3% | 8.7% |
| Result count | 15% | 0% | 0% |
The two right-hand columns answer different questions:
- Share of points asks what the average score was made of. Of 3,774.4 points awarded in total, 2,442.2 came from review depth.
- Share of the spread asks which part decides whether one search scores higher than another. That’s what drives any ranking built on the score. Here review depth mattered even more, at 74%.
So a score designed as one quarter reviews ranked searches mostly by reviews. Anyone reading “this category has a gap of 33” would have been reading a review count in disguise.
Audit 2: parts that could never move
Two parts were close to dead weight.
- Result count: 0 points on all 162 searches. We asked for 10 results and every search returned 10, so this part could never score. 15% of the design weight was decoration.
- Seller variety: 0 points on 131 of 162 searches. It only scored below 6 distinct sellers, and most searches had more. The median search returned 8 sellers. The part only switched on for the most concentrated shelves.
Review depth went the other way. It gave the full 25 points on 28 searches and 0 on 42. That’s a part doing most of the sorting on its own.
A part that never varies can’t affect a ranking. A part that’s nearly always zero only matters for a handful of cases. Neither shows up if you only read the weights.
Audit 3: blank fields read as zero
This was the worst error, and it’s the most common one in any score built from catalog or feed data.
The product-level rating was absent on 440 of 1,620 results, spread across 121 of the 162 searches. The score counted every absent rating as zero reviews. But not one rating in the snapshot had a count of zero. Every zero in the score’s medians was a blank.
To see how much that mattered, we ran a sensitivity check. We took the median of only the ratings that were present, and left a search’s review part as unknown when it had none.
| What changed | Review points removed | What it shows |
|---|---|---|
| 159 searches with at least one rating: blanks dropped | 516.4 | Blanks inflated the review part |
| 3 searches with no product rating at all | 75.0 (25 each) | These scored the maximum from blanks alone |
| Total | 591.4 | 24.2% of review points, 15.7% of the whole score |
That’s only the product level. Of those 440 results with no product rating, 106 carried a rating on their first variant, which the score never looked at. (Receipts cited by our guides.) The whole question of absent versus zero review data has its own page.
Two more findings from the same check:
- Fixing blanks wouldn’t have rescued it. With blanks treated as unknown, review depth still produced 58.8% of the points on the 159 searches with a known rating. 105 of them still had a median below 200. The 200 threshold was arbitrary, and most shelves sat under it.
- One handling choice reordered the categories. Changing only how blanks were read moved 13 of the 16 categories to a different position in the score’s category ranking, by up to 4 places. If a single defensible choice reshuffles a ranking that much, the ranking isn’t telling you about the categories. We don’t publish either version.
Audit 4: words matched, units missed
The word-match part counted how many of the search’s words (after trimming endings like “-s” and “-ing”) appeared in the top three results’ text. It had two blind spots, and the snapshot shows both.
It missed facts written in different units. Here’s the worked case, the search “toddler snowsuit rated for minus 30”:
| Part | Points | Why |
|---|---|---|
| Seller variety | 10.0 | 4 distinct sellers in the ten |
| Review depth | 25.0 | Only 4 of 10 carried a product rating, so the median was a blank, read as 0. Yet 9 of 10 carried a rating on the first variant |
| Word match | 18.0 | The matcher looked for “minus” and “30”. Position 2’s title says “protects to -30 °C” |
| Result count | 0 | Ten results, as requested |
| Total | 53.0 | One of the highest scores in the study |
Two listings on that shelf did state -30 °C. Position 2’s title says the suit “protects to -30 °C”. Position 9’s description rates the hood’s insulation to -30 °C, which isn’t the same promise as the whole suit. Our matcher treated “minus 30” and “-30 °C” as different things and reported a gap that didn’t exist. That’s our error, not the merchants’. How to test equivalent temperature expressions properly is covered in temperature matching.
It rewarded repeating the shopper’s words. On “humidifier for dry winter air large room quiet top fill”, the first result matched 8 of the 9 words the matcher used, “quiet” included. That word came from Shopify’s generated metadata (“Quiet operation ensures minimal disruption”). No decibel figure appeared anywhere in that record. A listing that says “quiet” scores as well as one that says “21 dB”. The score measured word overlap, not whether the fact a shopper needs was there.
Audit 5: what the score claimed versus what it measured
Put the four audits together and the score’s name was promising things its arithmetic never touched.
| The score implied | What it actually measured |
|---|---|
| “This shelf is weak for this need” | How few reviews the ten records carried in one field, with blanks counted as zero |
| “The listings don’t answer the question” | Whether the shopper’s words appeared, not whether the facts did |
| “One seller dominates” | First-variant seller IDs, and only below 6 |
| “There’s an opportunity here” | Nothing. It was never checked against picks, clicks, sales or any other outcome |
That last row matters most. Even a well-built score is only a description until someone checks it against an outcome. Ours was never checked against anything. Reading a Shopify Catalog result as a ChatGPT result is a separate mistake, covered in where Catalog research stops.
The stop-use record
| Item | Entry |
|---|---|
| Metric | The v0 “gap score” (0 to 100 per search), its category averages and category ranking |
| In use | October 26, 2026, our first catalog study only |
| Stopped | Evening of October 26, 2026, after an outside reviewer’s critique and our recheck against the saved responses |
| Reasons | The four audits above: contributions far from the weights; dead parts; blank ratings read as zero; unit-blind word matching. And no validation against any outcome |
| What stops | Every gap score, category average, category ranking and “opportunity” list from it, under this name or any other. Earlier internal tables are not to be quoted |
| What replaces it | No new score. Descriptive counts with named units: which fields were present or blank, which facts each listing stated and in which field, and sellers counted by ID |
| Where it’s noted publicly | What we retired, and why on the snapshot page |
| What would justify any future score | Proposed, not planned: each part tested against a stated outcome; blanks reported separately, never filled; units normalized and tested on known cases; contributions published next to the weights; and a sensitivity check on every judgement call |
Why there’s no universal score
People ask for one number. We don’t think a single number can be honest here. A humidifier shopper needs decibels, coverage and runtime. A snowsuit shopper needs a temperature rating and what it applies to. A backpack shopper needs dimensions in the right unit. Any weighted sum across those has to decide how many decibels a missing hood rating is worth, and that trade-off is invented, not measured. One number also hides the thing you’d actually fix: which fact is missing from which field. So we report the facts, field by field, and leave the blanks blank.
Check any score in seven questions (proposed)
This is our proposed checklist for a score you’re shown, whether it’s in a dashboard, an agency report or your own spreadsheet. It’s not an industry standard. Passing it doesn’t make a score predictive, but failing any one is a reason to stop quoting it.
| Check | Question to ask | How to run it |
|---|---|---|
| 1. Contribution | Does each part’s share of the points match its stated weight? | Get the per-item part scores, sum each part, divide by the total |
| 2. Spread | Which part decides the ranking? | Compare each part’s spread across items, or re-rank with one part removed |
| 3. Dead parts | Does any part never move? | Count items where each part is at its floor and its ceiling |
| 4. Blanks | Is a missing field scored as zero, unknown or dropped? | Recompute with a different choice and see whether the order changes |
| 5. Units | Are “-30 °C”, “minus 30” and “-22 °F” the same value to it? | Feed it known equivalent cases, plus a case that shouldn’t match |
| 6. Thresholds | Where do cut-offs like “200 reviews” or “6 sellers” come from? | Ask for the reason. Move each one and watch the ranking |
| 7. Outcome | Has the score ever been checked against picks, clicks or sales? | If not, call it a description, not a prediction |
Checks 1 and 4 alone would have caught our score in an afternoon.
How we checked
- Data. The 162 saved Shopify Catalog responses from October 26, 2026: public Global Catalog, read-only, Shopify’s command-line tool (
@shopify/ucp-cli0.9.1, catalog protocol version 2026-08-25), top 10 results, no buyer context. Full collection method on the snapshot page. - Recompute. On October 27 we ran the original scoring code, unchanged, against those responses. It matched every stored score to within rounding. We then recomputed each part separately, without rounding, and summed across searches.
- Spread. “Share of the spread” is each part’s covariance with the total score divided by the variance of the total, across the 162 searches. The four shares add up to 100%.
- Sensitivity. We replaced “blank equals zero” with the median of the product ratings present. The 3 searches with no product rating were left unknown and excluded. We changed nothing else. Category positions were compared by mean score under each version.
- By hand. We checked the snowsuit and humidifier cases against the saved responses field by field.
- What we didn’t do. We didn’t open product pages, query the catalog again, or ask any assistant. We didn’t build a corrected score.
Your next step
Take one score you’ve been shown, from any tool or report, and ask for the per-item part scores behind it. Run checks 1 and 4 from the table above. If nobody can give you the parts, you’ve learned the most important thing about that score already.